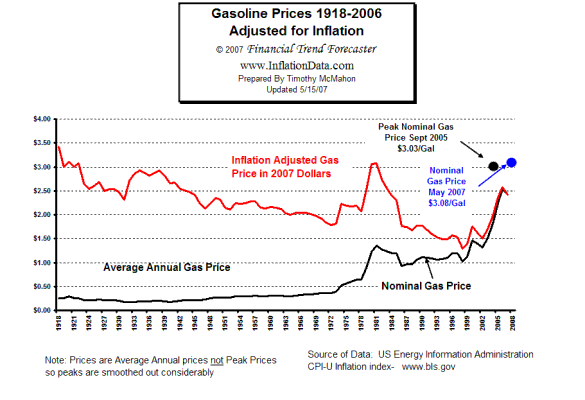
This chart, from www.InflationData.com , shows the inflation adjusted average annual gas price since the 1920's. What is interesting is the general downward trend since 1920 in the inflation adjusted price, with the exception of the oil embargo of the 1970's and the recent run-up. If the current bump smooths out, according to this trend line we should land somewhere between $2.00/gal in a few years. Or so I hope!
chicago car photos, car gallery chicago, chicago auto photos, chicago card photos, chicago automobile photos, chicago vehicle photos, chicago limo photos, chicago car photographs, chicago car designs.
Search This Blog
Inflation Adjusted Gas Prices You On Here » Inflation Adjusted Gas Prices
